Covid-19: Managing Risks in the Supply Chain
In my previous blog, I briefly discussed the consequences of COVID-19 on the supply chain. In recent weeks it has become increasingly clear what consequences a pandemic has on global trade. Ports are locked down or run with lower capacity, air traffic is almost down, containers and reefers are not always available where they are needed, staff are not available due to illness or because they cannot travel. Transport is becoming increasingly difficult due to closing borders. We see that certain sales channels suddenly dry up while on the other hand, new initiatives arise. This is a small selection of developments as a result of COVID-19. To top it of, nature decided to take it up a notch with night frost on the crops in some areas for a few nights.
Written by Ronald Staay, Fresh Produce consultant at Schouw Informatisering
Dependence on the global supply chain
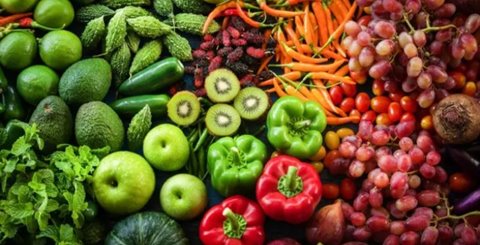
All developments that we read about every day. This has made it very clear to us is that we have become quite dependent on the global supply chain. Fruits and vegetables come from all over the world. In Spain, for example, four products imported to Barcelona (apples, grapes, rice, and potatoes) collectively cover almost 39,000 km to get there. At the same time, these items are also produced within a radius of 100 km around Barcelona. It seems like an unreal situation, but this is daily practice in our supply chains.
COVID-19 demonstrated the fragility of our global food chain and the degree to which all countries are dependent on the supply chain and all links in the chain. As stated earlier, we cannot protect ourselves against a pandemic such as COVID-19 through statistics and forecasts. What we can do is defend ourselves better by preparing for possible situations that could disrupt the logistical chain. By periodically reflecting on the risks that can arise within the logistical chain and how we can deal with them as a company. By actively managing the risks and periodically reevaluating, we can deal with or prevent surprises.
Collecting statistics in Foodware 365
All good and well, but how do you put this into practice? It starts with collecting statistics and data, which is where a central ERP system is essential. Foodware 365 is the heart of your organization where all essential information regarding customers, suppliers, forecasts, batch contracts, purchase and sales orders is recorded. By consulting this data through the Business Intelligence solution Food Management Dashboard with Power BI, you obtain insight into the volumes by product, country of origin, destination and suppliers and from customers. In addition to statistics and graphs, Power BI also offers you the option of projecting the information onto a map. We can also extract such statistics from the ERP platform Foodware 365 on the basis of the recorded forecasts, batch contracts and the sales and purchase orders in combination with the Food Management Dashboard and Power BI.
An overview of the entire supply chain
By combining the information collected in Foodware 365 into an overview of purchases per supplier, country of origin and sales per customer / destination, an overview is created of your entire supply chain. Statistics such as the purchase value and numbers per supplier / country of origin and sales / turnover per customer per destination country are also useful analyzes. This gives you direct insight into your important customers and suppliers. Foodware 365 offers the possibility to capture, collect and access the necessary information from the source for analysis.
The first steps of a risk analysis
Mapping where all fruit and vegetable products come from is important. Where are your suppliers located? And what is the importance of the relevant supplier for your company? In other words, how big is the impact of the relevant supplier on your company / turnover? How reliable is this supplier and what factors influence the supply of the products in question? But also identifying the importance and possible dependencies of your customers and their turnover, are the first steps of a risk analysis and management plan.
Identifying the possible risks
The next step is to identify potential risks that may affect the logistics chain. What risks are you exposed to in the purchasing channel, what risks are you exposed to with production and distribution, and what risks do you run into on the sales side? When we follow the reports surrounding COVID-19, every entrepreneur and supply chain manager can easily make a list of the relevant risks.
Then it is important to classify the risks, group them and investigate the magnitude and impact of the risks on your business operations. With a good understanding and insight into the risks in terms of content and impact, we must determine how to deal with these risks. Can the risks be eliminated, do we have to accept them, can we reduce the impact of the risk or can we refute it to the supplier or the customer?
Dealing with the identified risks
In other words, when the risks and associated impacts are known, it is important to determine how to deal with the identified risks. By preparing a risk response plan, you indicate per risk what the causes and possible triggers of the risk are. You determine what to do when the risk arises and who is responsible for it, and you also determine how you want to deal with the risk and which measures must be taken to limit the impact. Finally, it becomes important to implement the risk response plan and to evaluate and review the risk analysis where necessary.
Conduct your analysis
Foodware 365 in combination with Power BI offers great tools to conduct your analyzes. Foodware 365 offers you the possibility to record extensive article properties, such as product group, type, variety, and country of origin. At the customer and supplier level, in addition to the extensive master data, you also record your growers, certificates, and characteristics. In addition, your purchasing and sales process is recorded based on the purchase and sales orders. All this data is processed daily in the Data Warehouse Food Management Dashboard. This data is made available via Power BI and Microsoft Excel for analysis. For example, by combining the purchase order data with the countries of origin, you quickly get a graphical insight into the importance of each supplier to the result of your business. Power BI provides the ability to create a heat map and plot data on the map quickly and gain real-time insight into your supply chain and the impact on your business. The step can then be taken towards drawing up a risk matrix.

Get in contact
If you're interested and would like to discuss the potential a risk matrix holds for you or you would like to know more about what we can do for you with Foodware 365? Please contact us for a virtual cup of coffee.
 Nederlands
 English


